Overview
ROCnGO provides a set of tools to study a classifier performance by using ROC curve based analysis. Package may address tasks in these type of analysis such as:
- Evaluating global classifier performance.
- Evaluating local classifier performance when a high specificity or sensitivity is required, by using different indexes that provide:
- Better interpretation of local performance.
- Better power of discrimination between classifiers with similar performance.
- Evaluating performance on several classifier simultaneously.
- Plot whole, or specific regions, of ROC curves.
Installation
install.packages("ROCnGO")Alternatively, development version of ROCnGO can be installed from its GitHub repository with:
# install.packages("devtools")
devtools::install_github("pabloPNC/ROCnGO")
Usage
library(ROCnGO)

# Iris subset
iris_subset <- iris[iris$Species != "versicolor", ]

# Select Species = "virginica" as the condition of interest
iris_subset$Species <- relevel(iris_subset$Species, "virginica")

# Summarize a predictor over high sensitivity region
summarize_predictor(
  iris_subset,
  predictor = Sepal.Length,
  response = Species,
  threshold = 0.9,
  ratio = "tpr"
)
#> ℹ Upper threshold 1 already included in points.
#> • Skipping upper threshold interpolation
#> # A tibble: 1 × 5
#>     auc   pauc np_auc fp_auc curve_shape
#>   <dbl>  <dbl>  <dbl>  <dbl> <chr>
#> 1 0.985 0.0847  0.847  0.852 Concave
# Summarize several predictors simultaneously
summarize_dataset(
  iris_subset,
  predictors = c(Sepal.Length, Sepal.Width, Petal.Length, Petal.Width),
  response = Species,
  threshold = 0.9,
  ratio = "tpr"
)
#> ℹ Lower 0.9 and upper 1 thresholds already included in points
#> • Skipping lower and upper threshold interpolation
#> $data
#> # A tibble: 4 × 6
#>   identifier     auc   pauc np_auc fp_auc curve_shape
#>   <chr>        <dbl>  <dbl>  <dbl>  <dbl> <chr>
#> 1 Sepal.Length 0.985 0.0847 0.847   0.852 Concave
#> 2 Sepal.Width  0.166 0.0016 0.0160  0.9   Hook under chance
#> 3 Petal.Length 1     0.1    1       1     Concave
#> 4 Petal.Width  1     0.1    1       1     Concave
#>
#> $curve_shape
#> # A tibble: 2 × 2
#>   curve_shape       count
#>   <chr>             <int>
#> 1 Concave               3
#> 2 Hook under chance     1
#>
#> $auc
#> # A tibble: 2 × 3
#> # Groups:   auc > 0.5 [2]
#>   `auc > 0.5` `auc > 0.8` count
#>   <lgl>       <lgl>       <int>
#> 1 FALSE       FALSE           1
#> 2 TRUE        TRUE            3
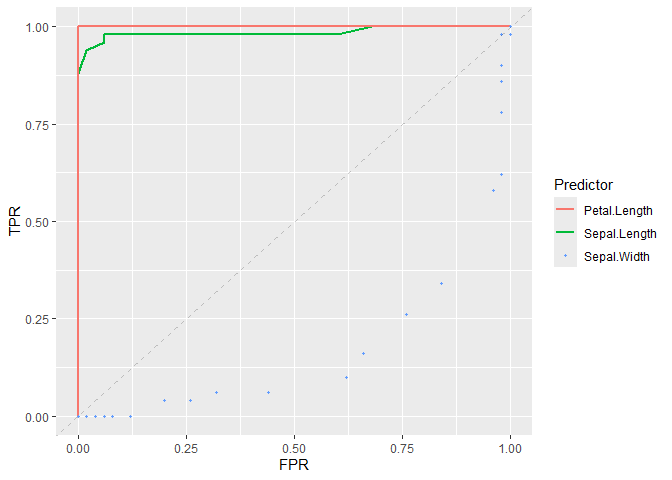
# Plot ROC curve of classifiers
plot_roc_curve(iris_subset, predictor = Sepal.Length, response = Species) +
  add_roc_curve(iris_subset, predictor = Petal.Length, response = Species) +
  add_roc_points(iris_subset, predictor = Sepal.Width, response = Species) +
  add_chance_line()