Plot chance line in a ROC plot.
Examples
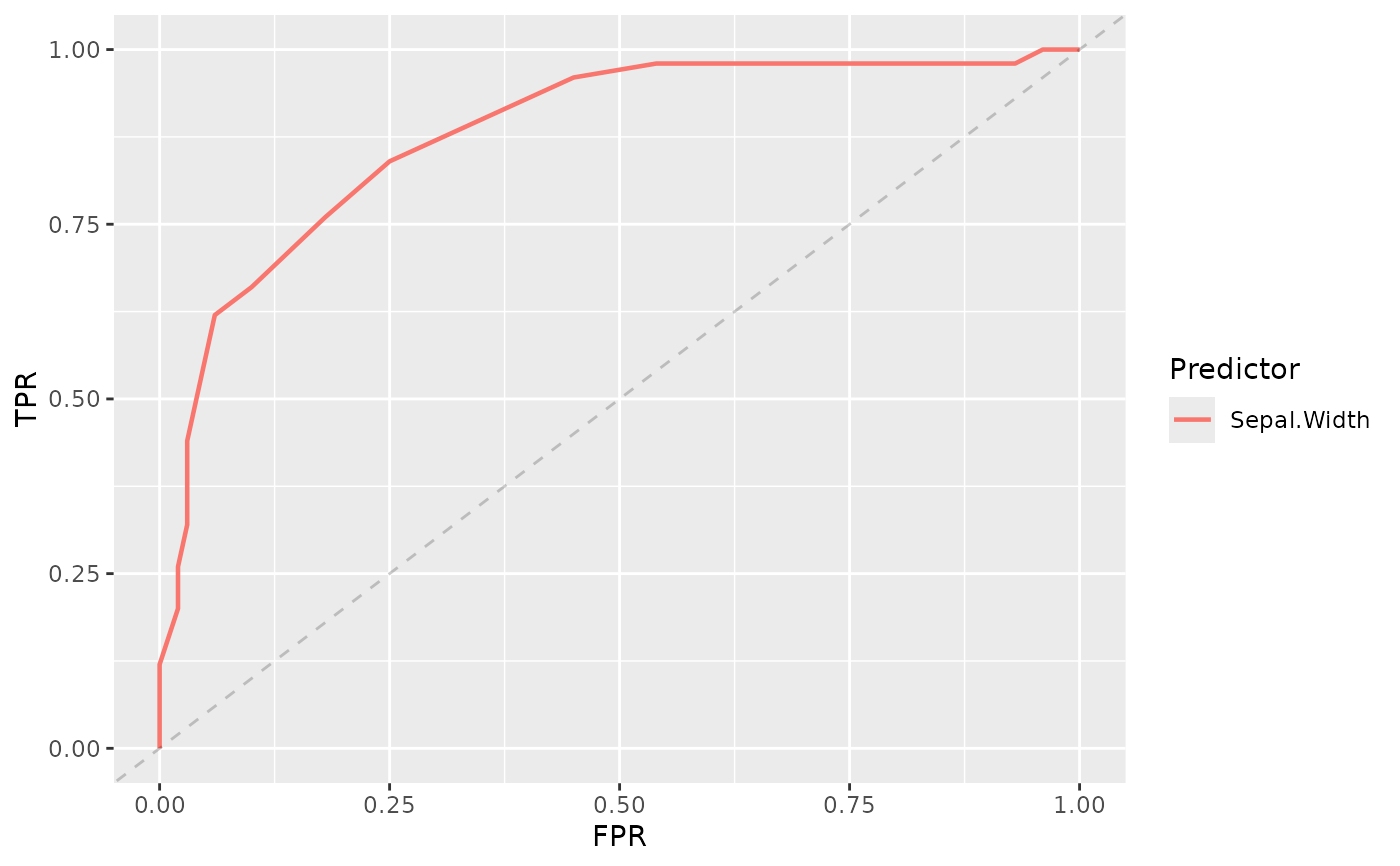
plot_roc_curve(iris, response = Species, predictor = Sepal.Width) +
 add_chance_line()
#> Warning: Using `size` aesthetic for lines was deprecated in ggplot2 3.4.0.
#> ℹ Please use `linewidth` instead.
#> ℹ The deprecated feature was likely used in the ROCnGO package.
#>   Please report the issue at <https://github.com/pabloPNC/ROCnGO/issues>.
#> Ignoring unknown labels:
#> • fill : "Bound"