Calculate and plot lower bound defined by FpAUC sensitivity index.
add_fpauc_lower_bound()provides an upper level function which automatically calculates curve shape and plots a lower bound that better fits it.add_fpauc_partially_proper_lower_bound()andadd_fpauc_concave_lower_bound()are lower level functions that enforce the plot of specific bounds.
First one plots lower bound when curve shape is partially proper (presents some kind of hook). Second one plots lower bound when curve shape is concave in the region of interest.
Usage
add_fpauc_partially_proper_lower_bound(
  data,
  response = NULL,
  predictor = NULL,
  threshold,
  .condition = NULL,
  .label = NULL
)

add_fpauc_concave_lower_bound(
  data,
  response = NULL,
  predictor = NULL,
  threshold,
  .condition = NULL,
  .label = NULL
)

add_fpauc_lower_bound(
  data,
  response = NULL,
  predictor = NULL,
  threshold,
  .condition = NULL,
  .label = NULL
)
Arguments
- data
A data.frame or extension (e.g. a tibble) containing values for predictors and response variables.
- response
A data variable which must be a factor, integer or character vector representing the prediction outcome on each observation (Gold Standard).
If the variable presents more than two possible outcomes, classes or categories:
The outcome of interest (the one to be predicted) will remain distinct.
All other categories will be combined into a single category.
New combined category represents the "absence" of the condition to predict. See
.conditionfor more information.- predictor
A data variable which must be numeric, representing values of a classifier or predictor for each observation.
- threshold
A number between 0 and 1, inclusive. This number represents the lower value of TPR for the region where to calculate and plot lower bound.
Because of definition of
fp_auc(), region upper bound will be established as 1.- .condition
A value from response that represents class, category or condition of interest which wants to be predicted.
If
NULL, condition of interest will be selected automatically depending onresponsetype.Once the class of interest is selected, rest of them will be collapsed in a common category, representing the "absence" of the condition to be predicted.
See
vignette("selecting-condition")for further information on how automatic selection is performed and details on selecting the condition of interest.- .label
A string representing the name used in labels.
If
NULL, variable name frompredictorwill be used as label.
Examples
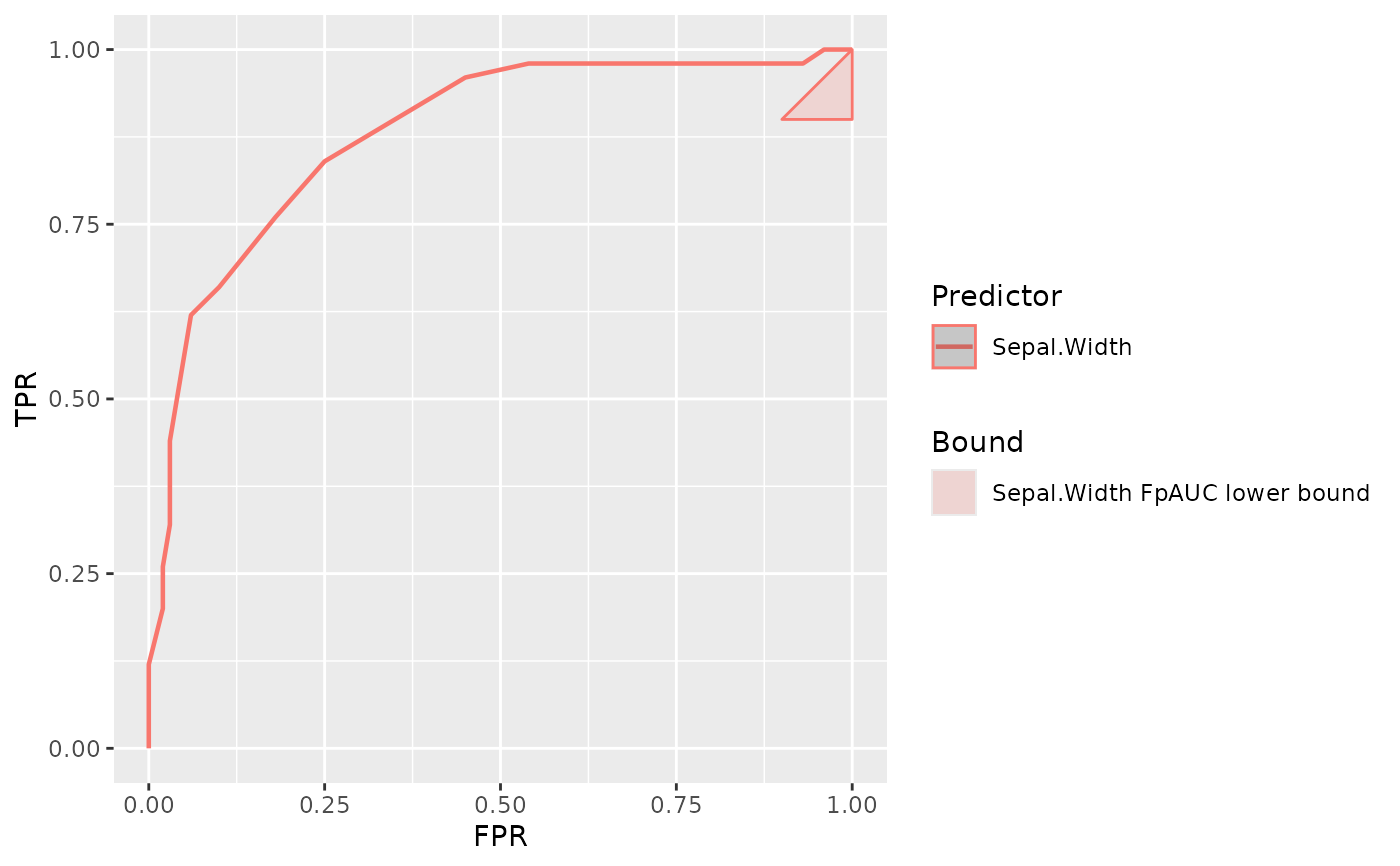
# Add lower bound based on curve shape (Concave)
plot_roc_curve(iris, response = Species, predictor = Sepal.Width) +
  add_fpauc_lower_bound(
    data = iris,
    response = Species,
    predictor = Sepal.Width,
    threshold = 0.9
  )
#> ℹ Upper threshold 1 already included in points.
#> • Skipping upper threshold interpolation